


The Challenge: Metrics Without Common Dimensions
In today's data-driven enterprises, business intelligence teams need to provide unified access to diverse metrics through a single analytics platform. While these metrics are all part of the business story, they often lack common dimensions for traditional joining. Consider a typical enterprise with hundreds of individual metrics in their semantic layer:
- Policy metrics: Average_Policy_Term_Premium, Product_Category, Primary_Contact_Type
- Claims metrics: Total_Claim_Reserves_Amount, Claim_Status, Exposure_Type
- Account metrics: Total_Active_Accounts, Account_Type, Account_Status
- Financial metrics: Total_Reserve_Amount, Reserve_Type, Set_Date
Each metric is independent with predefined business rules, has its own dimensions and filters, and serves distinct analytical purposes. In Codd's Semantic Layer (CSL), each metric appears as its own table with its specific dimensions and measures. Yet business leaders want to see them all in unified dashboards and compare performance across these domains.
How Tableau Handles Multiple Tables
Tableau's data modeling requires all tables within a single data source to have defined relationships - a smart design choice that prevents accidental cartesian products and ensures proper data modeling. This works brilliantly for traditional star schema designs where fact tables naturally relate through common dimension tables.
However, this creates a challenge when dealing with metrics that don't share common dimensions for joining. When you connect to a database containing multiple tables without shared join keys, Tableau still requires you to define relationships between them. Without these relationships, Tableau throws an error when connecting to the data source.
The Traditional Workarounds (And Why They Fall Short)
Teams typically resort to these approaches:
-
Multiple Data Sources: Create separate connections for each metric family
- Performance overhead from multiple connections
- Complex dashboard maintenance with multiple refresh schedules
-
Data Warehouse Pre-joins: Create wide denormalized tables
- Explosion of NULL values for unrelated dimensions
- ETL complexity and maintenance burden
- Loss of semantic meaning and business context
-
Custom SQL Unions: Force tables together with SQL
- Difficult to maintain as metrics evolve
- Poor performance at scale
- Breaks Tableau's native optimization capabilities
The CSL Solution: Strategic Dummy Table Architecture
At Codd, we developed an elegant solution that works within Tableau's constraints while maintaining the independence and semantic clarity of our metrics. The approach centers on a strategic "dummy table" pattern that provides the minimal scaffolding Tableau needs while preserving metric autonomy.
Understanding the Dummy Table Concept
Think of the dummy table as a "universal adapter" – a single point that all your independent metrics can connect to, satisfying Tableau's requirement for relationships without actually constraining your data. It's like having a central hub in a wheel where all spokes connect, but the spokes themselves never touch each other.
How Users Connect: Step-by-Step Guide
The Beauty of PostgreSQL Protocol: Zero Setup Required
One of the most powerful aspects of CSL's approach is using the PostgreSQL wire protocol. This means:
- No custom drivers to install - Tableau already has PostgreSQL support built-in
- No additional setup or configuration - Works out of the box
- No compatibility issues - PostgreSQL connector is mature and well-tested
- IT-friendly - No special software deployment needed across your organization
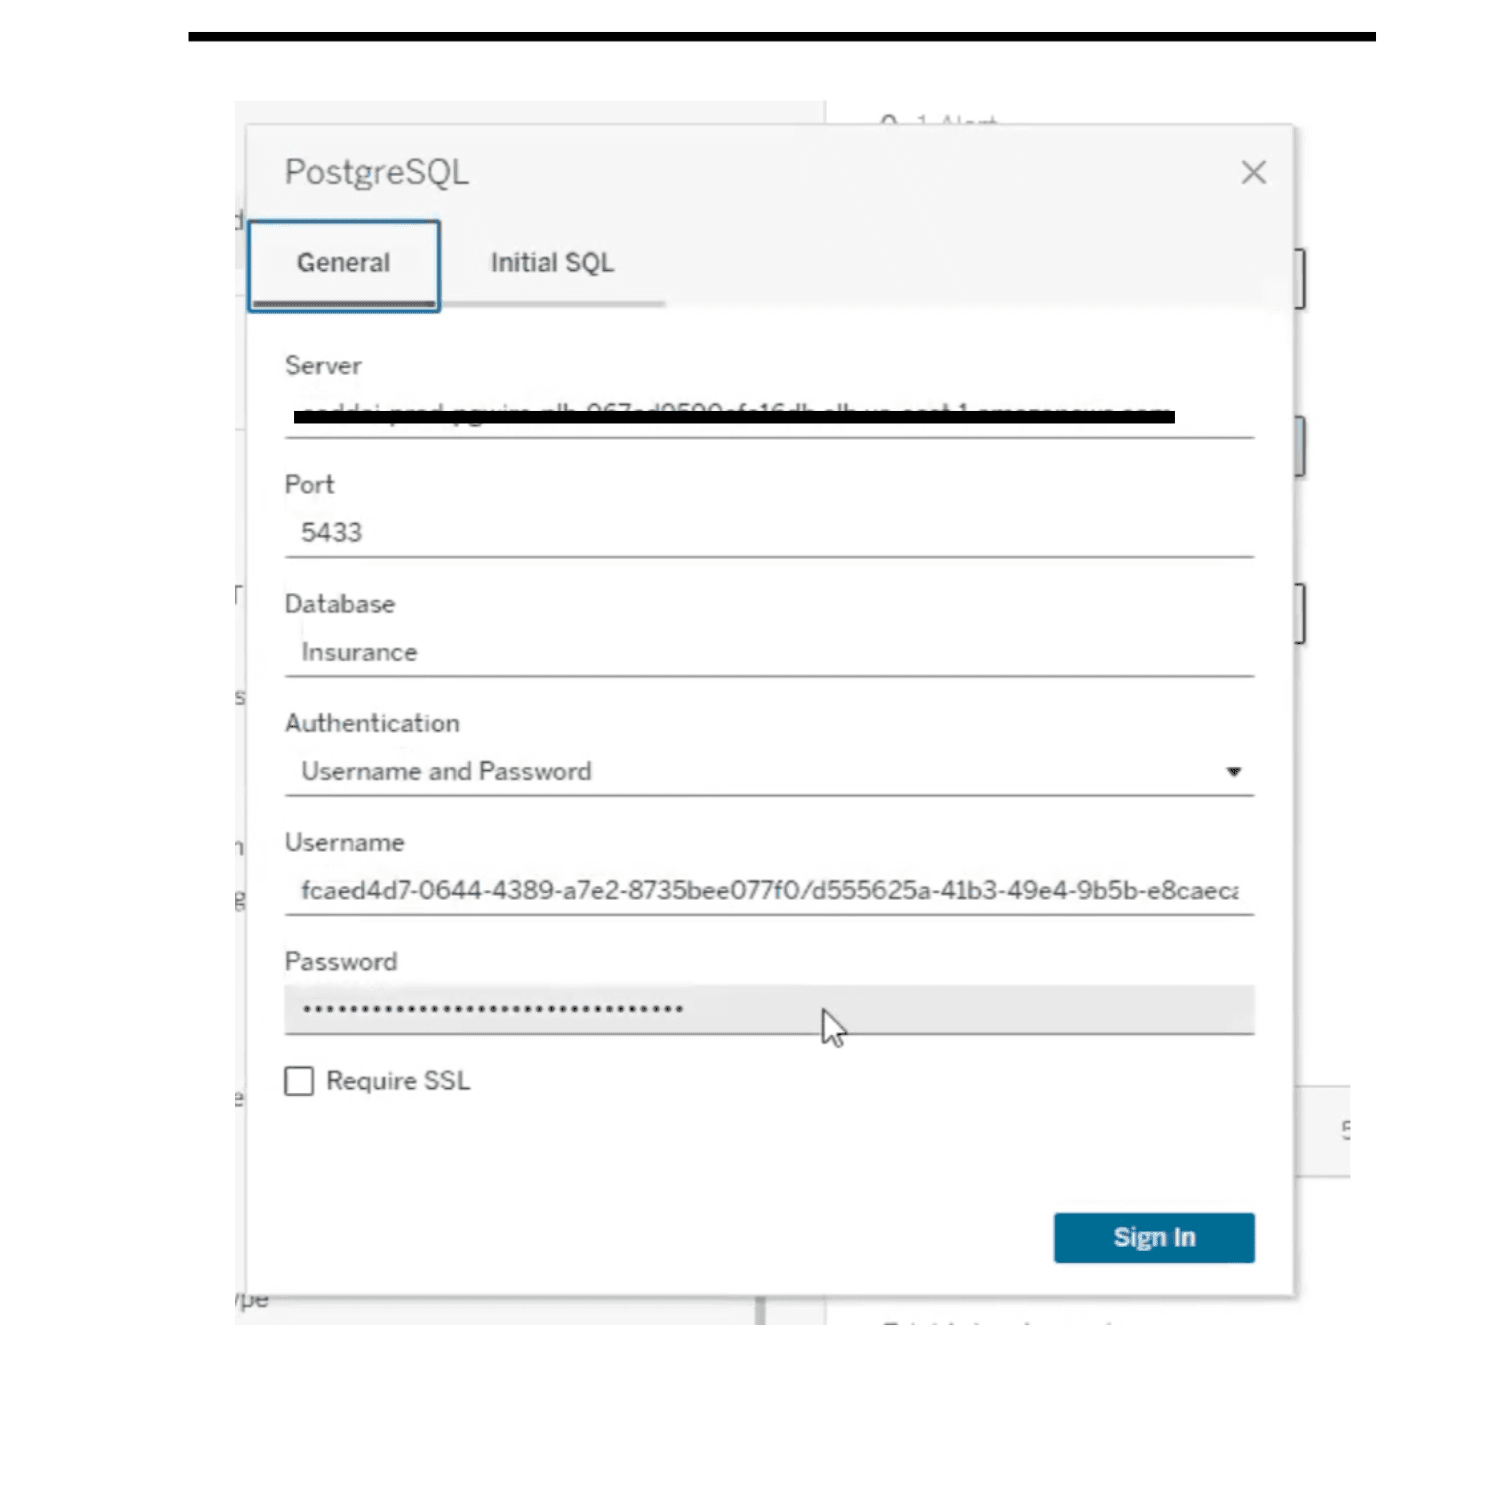
Initial Connection to CSL
When connecting Tableau to the Codd Semantic Layer, users simply use Tableau's native PostgreSQL connector:
- Open Tableau Desktop
- Select Connect → To a Server → PostgreSQL (already available, no download needed!)
- Enter connection details:
- Server: Your CSL server address
- Port: 5433 (CSL's PgWire port)
- Database: Your corpus name
- Username: Format as
tenantId/brainId/userId - Password: Your API key
Understanding What You See
How CSL Maps to Tableau's Structure
When you connect to CSL, there's a natural mapping between CSL's semantic concepts and Tableau's database structure:
- Corpus → Database Schema: Your corpus (collection of related metrics) appears as a database schema in Tableau
- Metrics → Tables: Each individual metric in your corpus shows up as a separate table
- Dimensions & Measures → Columns: The dimensions and measures within each metric become table columns
Once connected, Tableau displays your semantic layer structure:
- Database: Your corpus name
- Schema: Your corpus (e.g., "Sales Analytics", "Marketing Performance")
- Tables:
- csl_dummy: The special single-row connector table
- Average_Policy_Term_Premium: Policy premium metrics
- Total_Claim_Reserves_Amount: Claims reserve metrics
- Total_Active_Accounts: Active account metrics
- New_Accounts_Created: Account creation metrics
- (And all other metrics in your corpus)
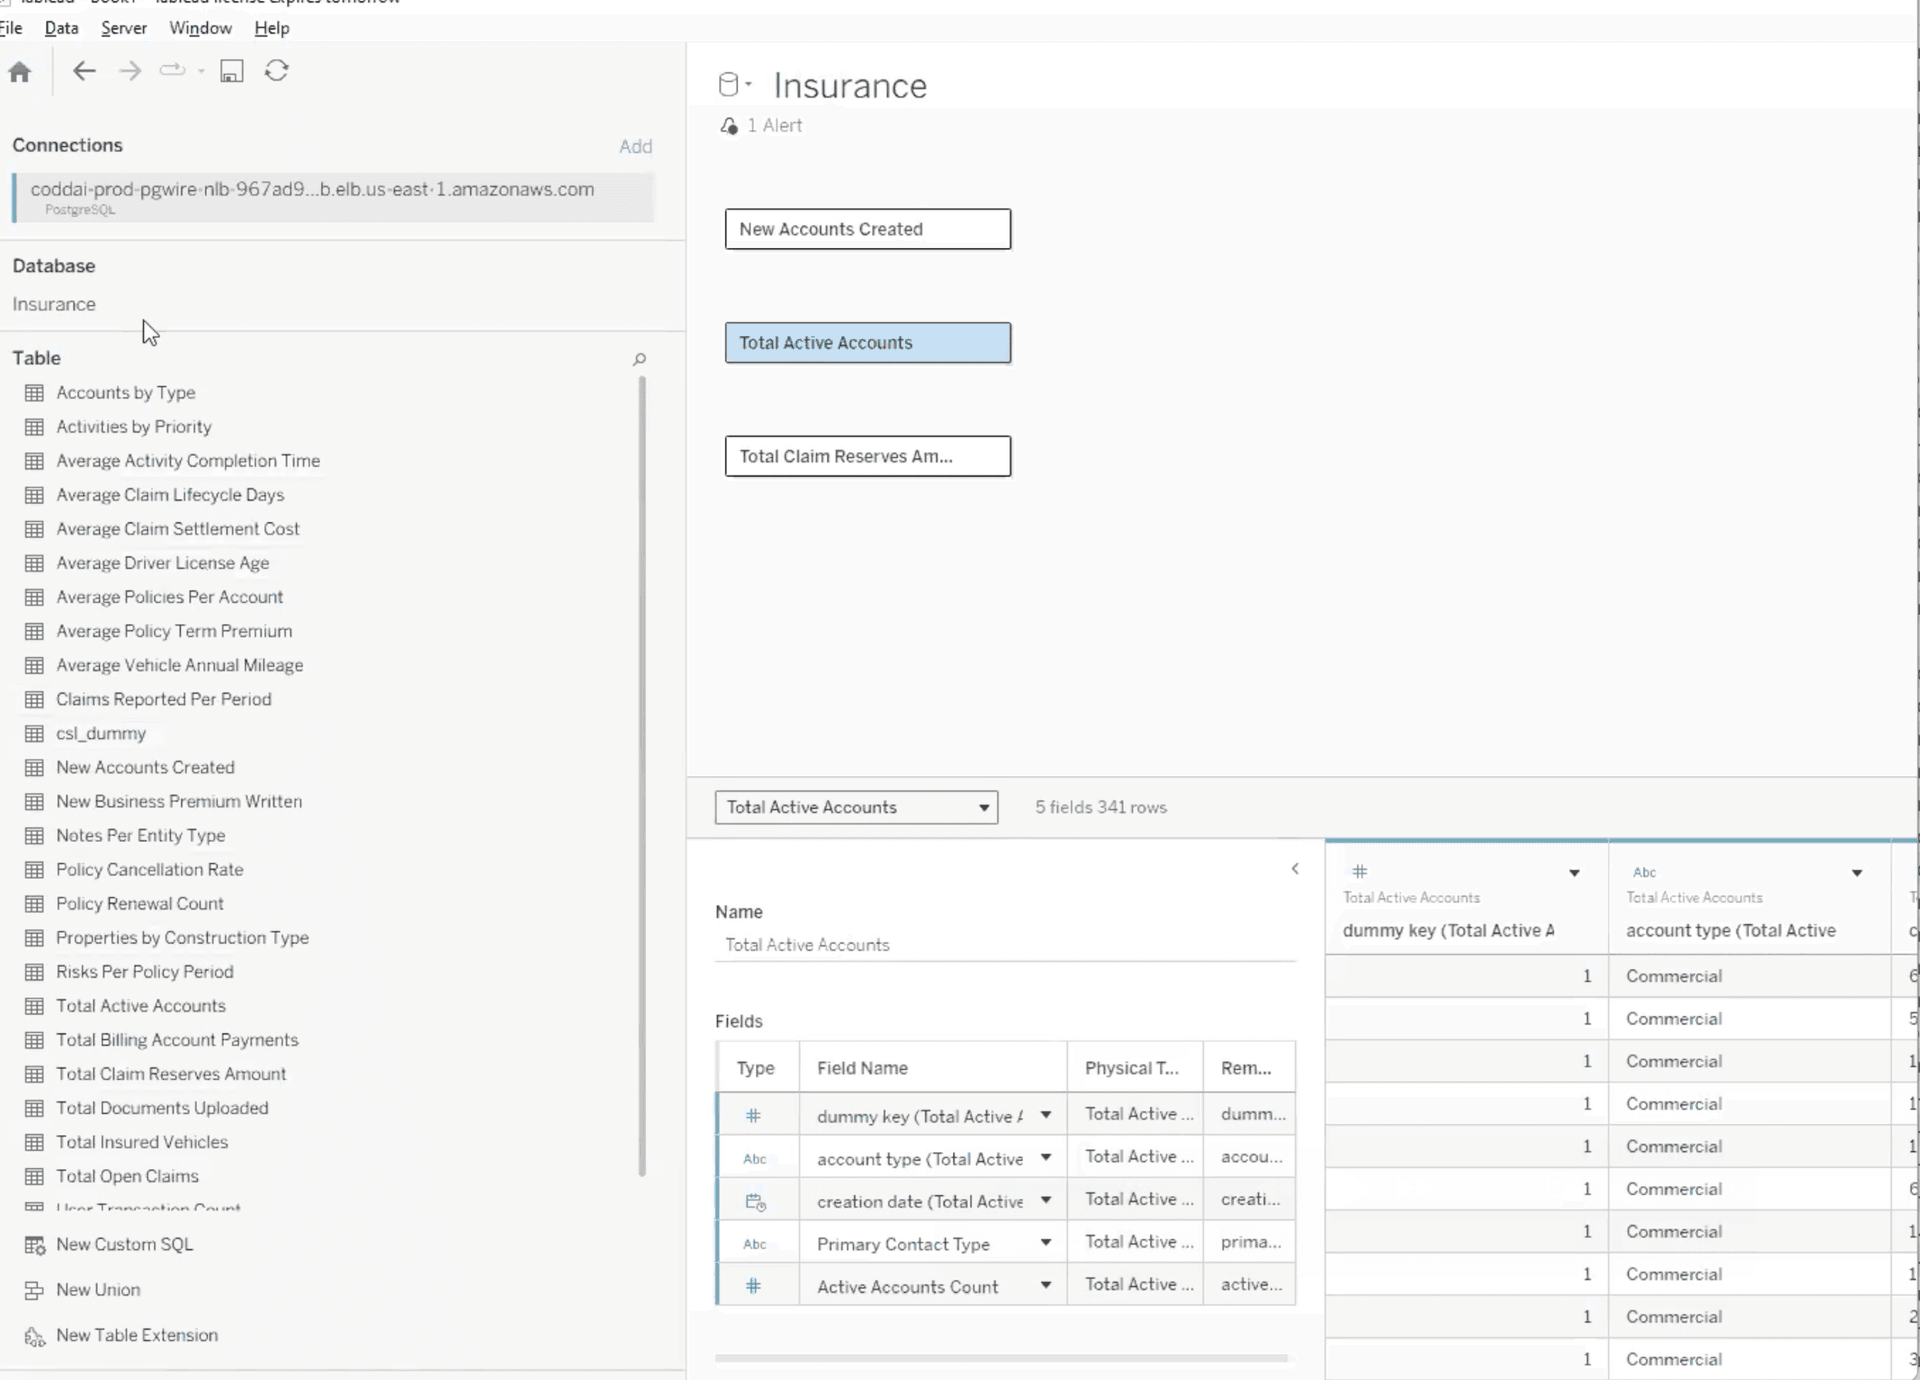
Understanding the Column Structure
When you expand any metric table, you'll see:
- dummy_key: The connector column (present in all tables)
- Dimensions: Adjuster_Name, Claim_Status, Exposure_Type, Account_Type, etc.
- Measures: Total_Reserve_Amount, Claim_Count, Premium_Amount, etc.
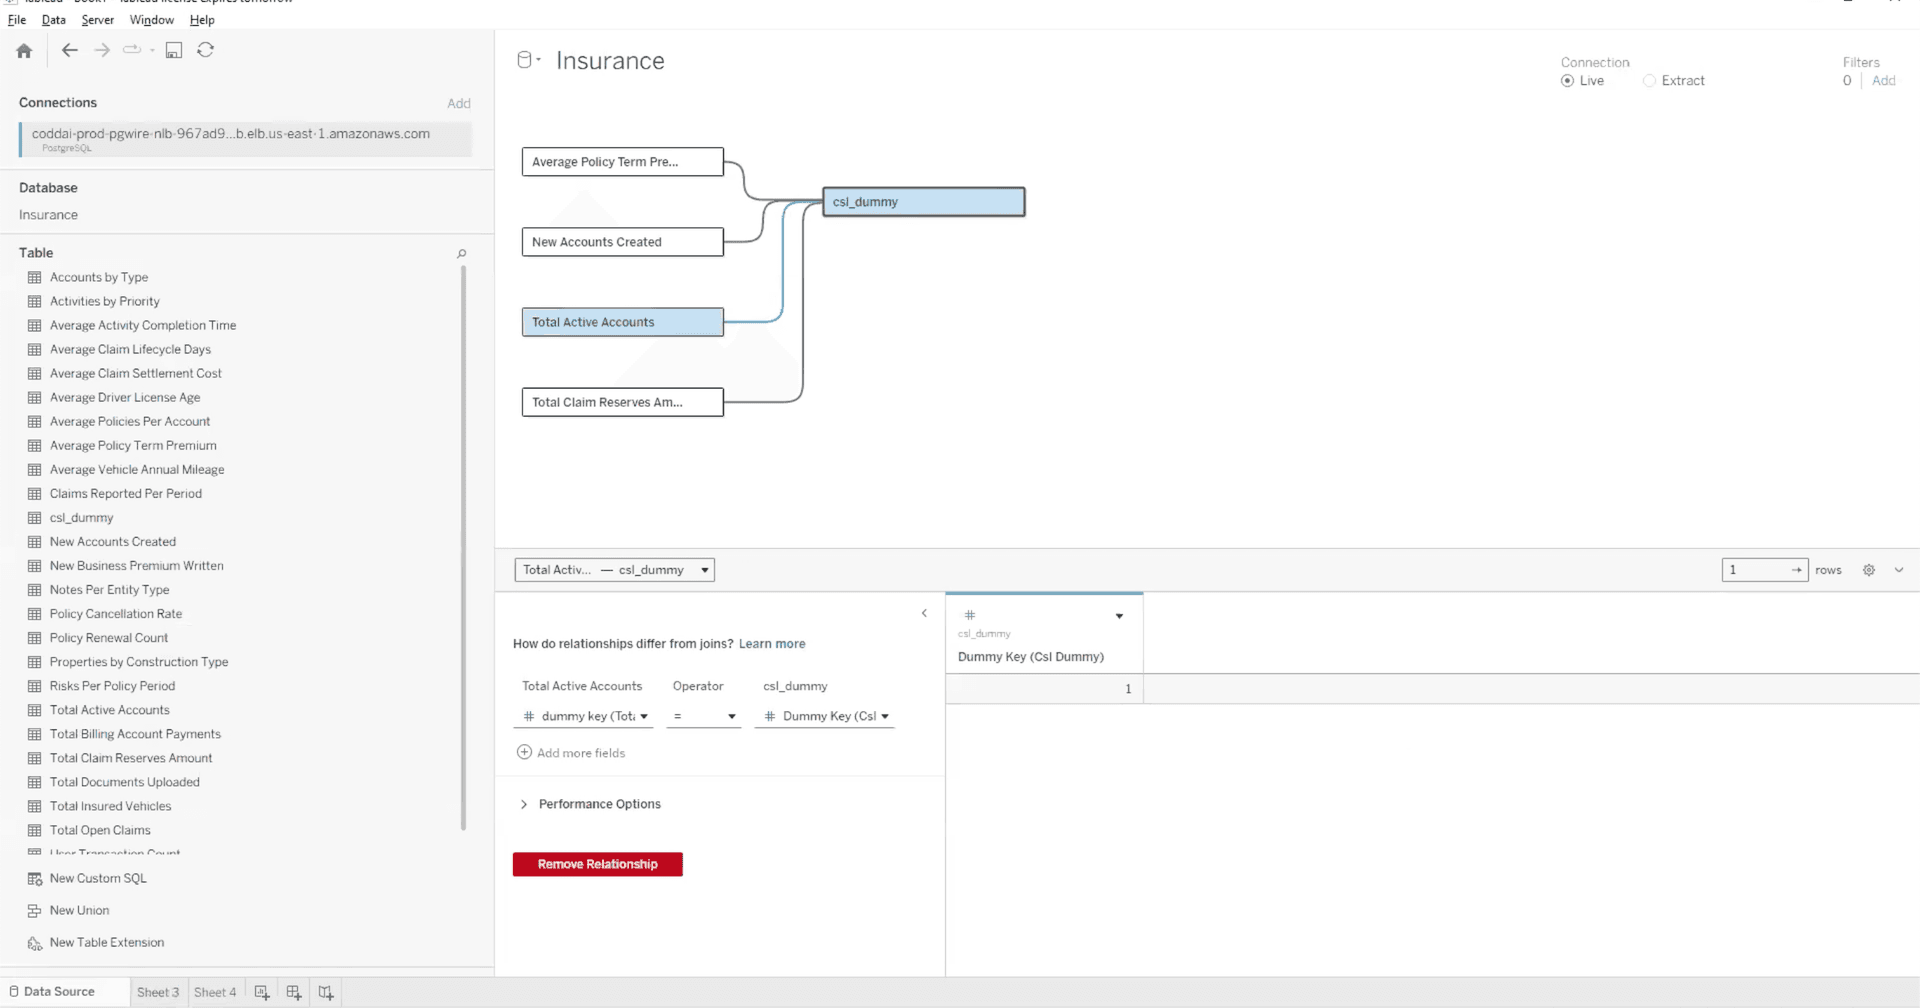
Setting Up Relationships
Here's where the magic happens. Tableau will prompt you to define relationships:
- Tableau shows the relationship canvas with all your tables
- You'll notice each metric table has a field called
dummy_key - Create relationships by dragging from
csl_dummy.dummy_keyto each metric'sdummy_keyfield
Working with Your Data
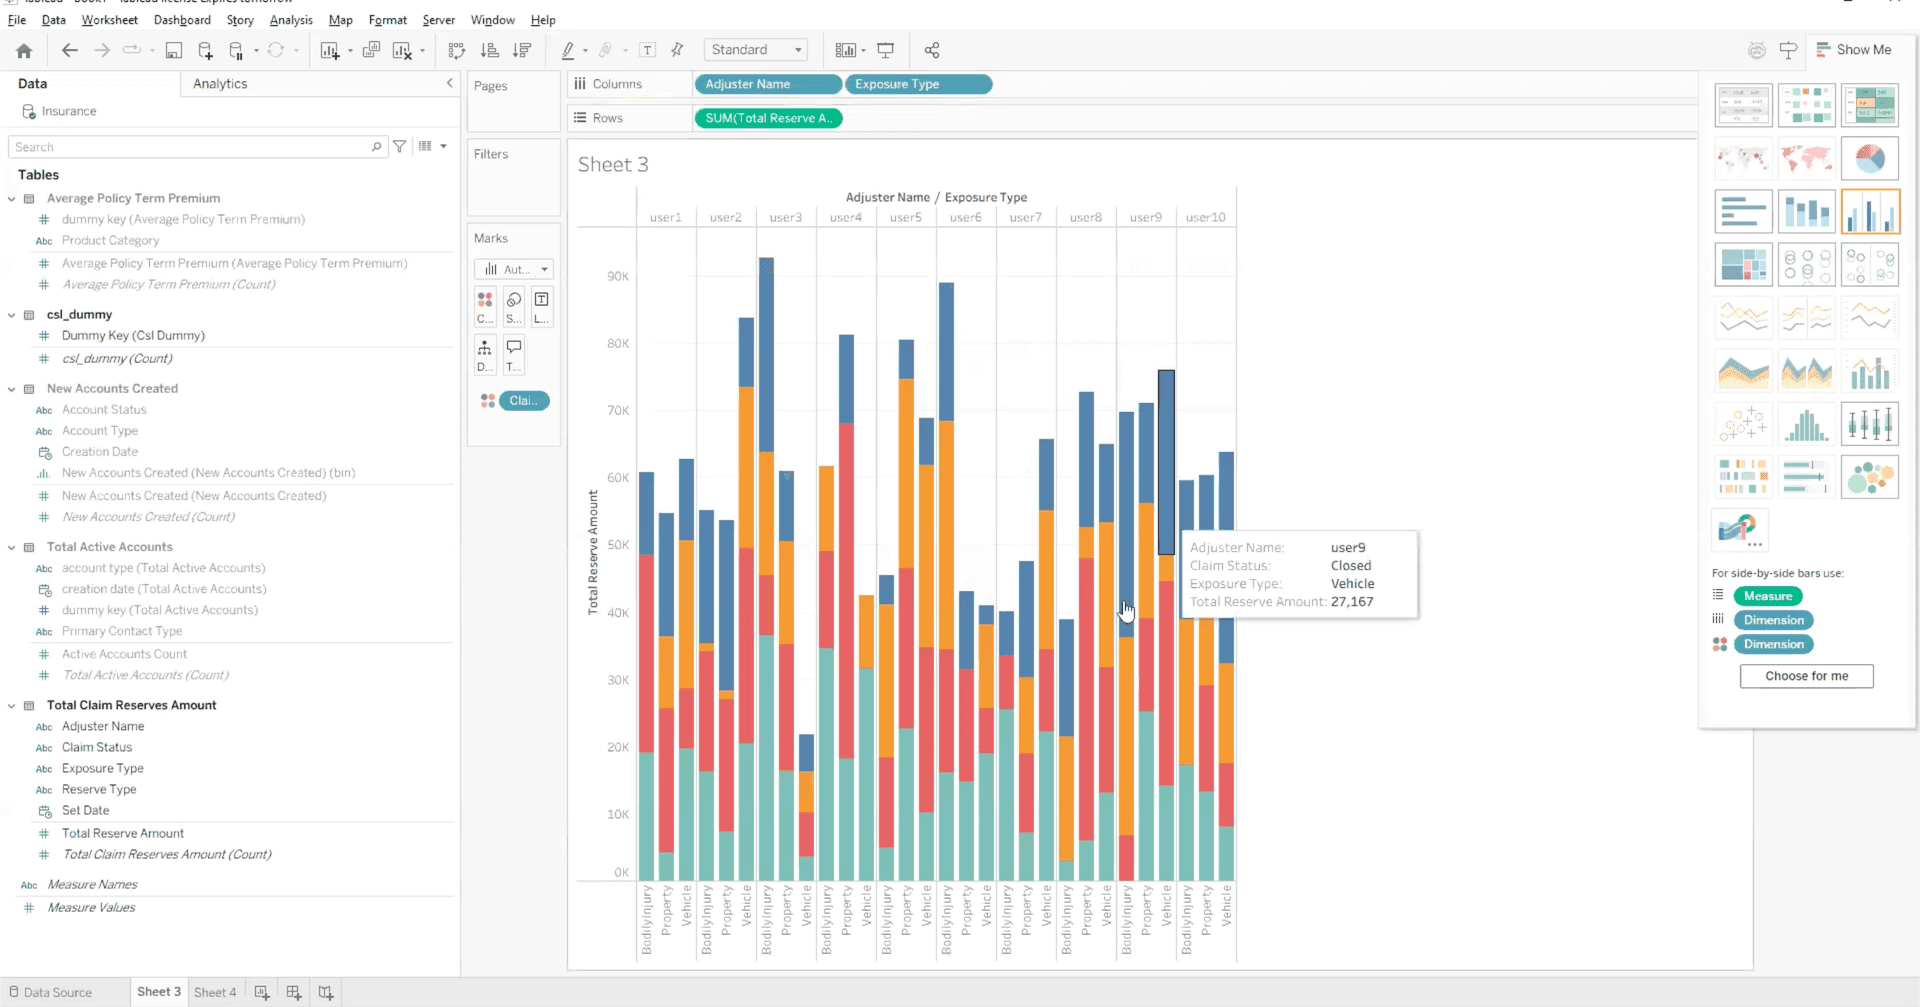
Once relationships are established, the user experience is seamless:
- All metrics appear in the Data pane under their respective tables
- Each metric works independently on its own worksheet with its specific dimensions
- Unrelated metrics can be displayed in different worksheets using the same data source connection
- Combine metrics with shared dimensions on the same worksheet (e.g., metrics sharing date_id)
- Create unified dashboards with multiple worksheets showing different metrics
- Apply dashboard-level filters that affect all relevant metrics
The Key Difference
Without CSL's Dummy Table Approach:
- Create multiple separate data sources for each metric family
- Build independent worksheets with limited interaction between sources
- Struggle with consistent filtering across different data sources
- Deal with separate refresh schedules and connection maintenance
- Complex credential management for each connection
With CSL's Dummy Table Approach:
- Single connection to CSL with all metrics immediately available
- Drag any metric to create visualizations on separate worksheets
- Combine metrics with shared dimensions on the same worksheet
- Dashboard-level filters automatically apply to all relevant metrics
- Single refresh updates everything through one connection
The result is a cohesive analytics experience where all metrics work seamlessly together despite being independent, with simplified maintenance and improved performance through a single data source connection.
Behind the Scenes: Why This Works
The csl_dummy table has a single row with a single column (dummy_key = 1). Every metric table includes this same dummy_key value for all its rows. This creates a valid relationship that Tableau can use for its metadata model.
Here's the clever part: while Tableau sees these relationships and is satisfied, they're never used in actual JOIN operations. When you query the Average_Policy_Term_Premium metric, it runs independently. When you query the Total_Claim_Reserves_Amount metric, it also runs independently. The dummy relationship exists purely to satisfy Tableau's requirement.
Since the relationships aren't used in queries:
- No cartesian products
- No unnecessary data multiplication
- No JOIN overhead
- Queries run as fast as if tables were completely independent
The beauty of this approach is that it works universally. Some of your metrics might actually have natural relationships through shared dimensions:
- Daily_Revenue and Daily_Active_Users both have date_id dimension
- Monthly_Sales and Monthly_Marketing_Spend both have month_id dimension
- Quarterly_Growth and Quarterly_Churn both have quarter_id dimension
In a traditional approach, you'd need to manage these real relationships separately from unrelated metrics. With the dummy table pattern:
- All metrics connect the same way - through the dummy table
- Metrics with shared dimensions can be combined on the same worksheet (e.g., Daily_Revenue and Daily_Active_Users both having date_id)
- Unrelated metrics work perfectly on separate worksheets within the same dashboard
- No need to manage complex relationship hierarchies - one simple pattern for everything
- Dashboard-level filters work across worksheets affecting all metrics with relevant dimensions
Conclusion
The dummy table pattern in Codd's Semantic Layer represents more than just a technical workaround; it's a thoughtful architectural decision that respects both Tableau's design philosophy and the reality of modern enterprise data.
By providing the minimal structure Tableau requires while maintaining complete metric independence, we've created a solution that is elegant, scalable, and performant with no overhead on query execution.
For organizations struggling with Tableau's relationship requirements, this pattern offers a practical solution that works within the tool's constraints while preserving the independence of your metrics.
The dummy table approach shows how semantic layers can bridge the gap between tool requirements and business needs, enabling unified analytics without forcing unnatural data relationships.
Interested in learning more about Codd's Semantic Layer? Visit codd.ai or schedule a demo to see it in action.