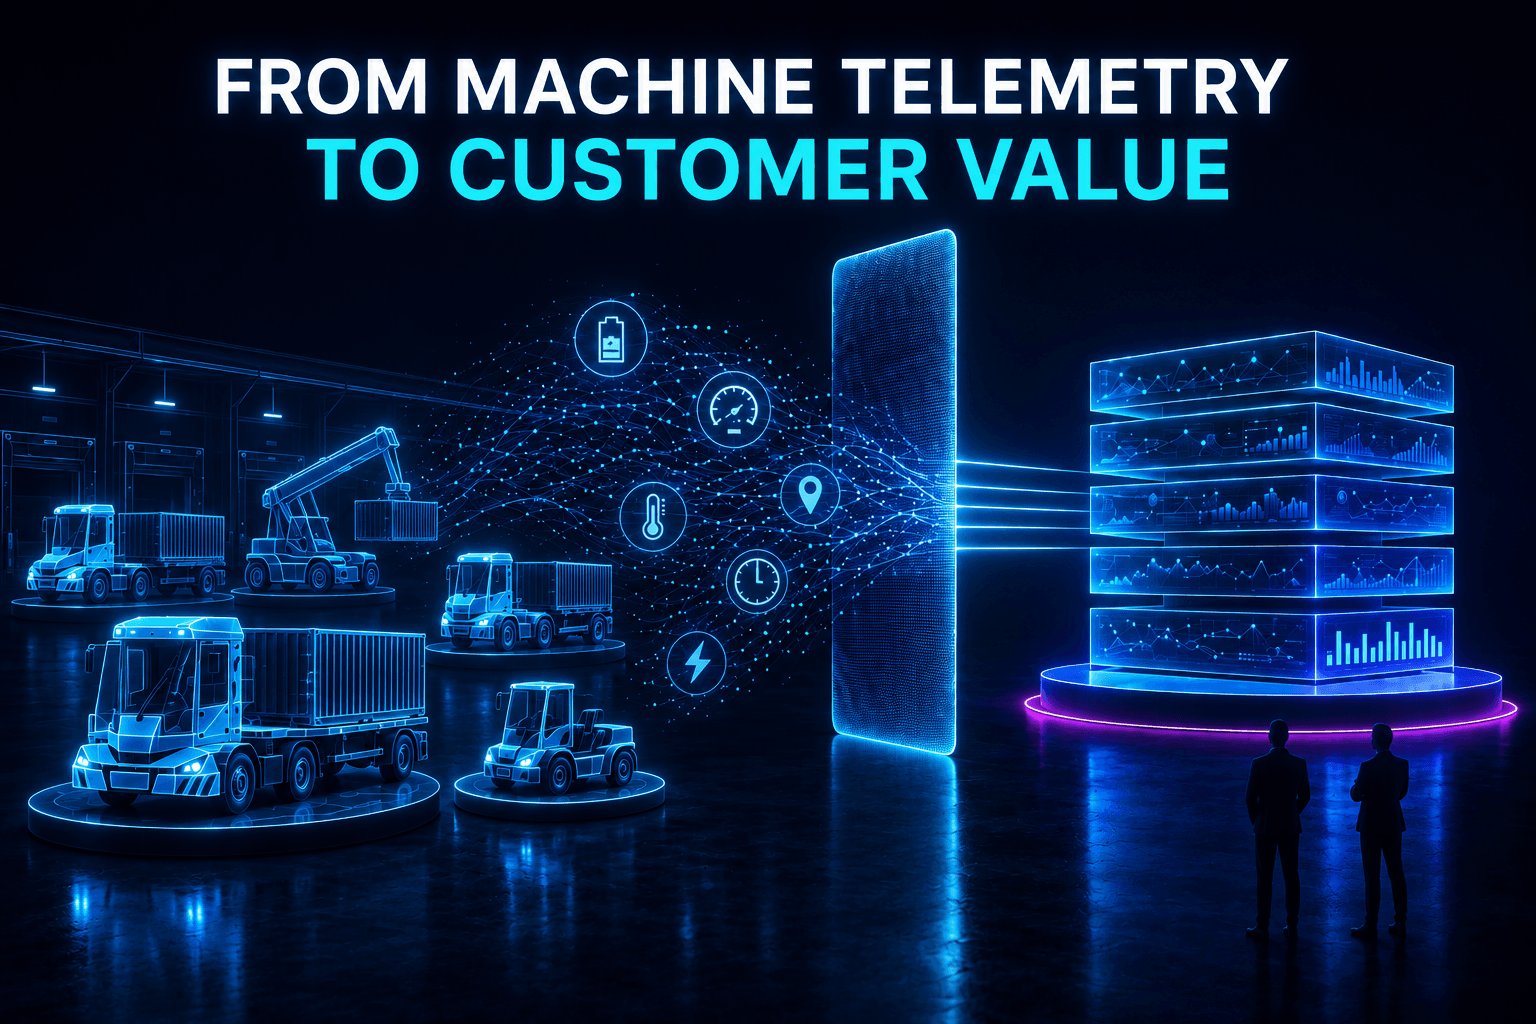
Connected machines generate extraordinary amounts of data.
Commercial vehicles, industrial equipment, warehouse systems, robots, energy systems, and other connected products continuously produce telemetry describing what they are doing. Battery levels. Operating states. Location. Temperature. Distance traveled. Charging activity. Equipment connections. Idle time. Fault conditions.
For manufacturers and equipment providers, collecting this data has become relatively straightforward. Sensors send readings to a central platform, where they can be stored and analyzed.
But collecting telemetry and turning it into useful customer intelligence are two very different problems.
Customers don't really want more sensor data.
They want answers.
How much are we actually using our equipment? Which machines spend the most time idle? How much productive work are we getting from each machine? Which locations are underutilizing their fleet? Are charging patterns affecting operational availability? Where could we improve productivity?
Historically, answering these questions has meant building dashboards and reports. But as connected products become more sophisticated, and the amount of telemetry they generate grows, the traditional dashboard model can become a bottleneck for both equipment providers and their customers.
Codd AI has been working with one provider to use generative AI and natural language analytics to build a better approach.
Instead of trying to anticipate every question a customer might ask and building another dashboard to answer it, what if customers could simply ask questions of their operational data?
Getting there, however, requires solving a problem that is easy to underestimate:
AI needs to understand what the telemetry actually means.
The Hidden Complexity Inside Machine Telemetry
Consider an electric commercial vehicle used inside a large logistics yard.
Its job is relatively straightforward: move trailers between locations such as staging areas, parking areas, and loading docks. Traditionally, these operations might use diesel-powered yard tractors. New electric alternatives can reduce fuel consumption and emissions while providing another significant advantage: they are highly connected.
Each machine can continuously report operational telemetry to its manufacturer.
That data might include:
- battery charge
- odometer readings
- operating state
- idle state
- charging state
- machine location
- trailer connected or disconnected
- operating hours
- diagnostic information
From a distance, analyzing this data sounds straightforward.
Put the telemetry into a database. Connect a BI tool. Build some dashboards.
The reality is more complicated.
Imagine a simplified telemetry table containing five fields: Timestamp, Machine, Site, Type, and Reading.
The Type field identifies the kind of signal being reported: battery level, odometer, operating state, charging status, or another reading.
For example, three readings from machine ATM_US_25 on 28 May:
| Timestamp | Machine | Type | Reading |
|---|---|---|---|
| 8:00 AM | ATM_US_25 | Odometer | 10,243 |
| 2:00 PM | ATM_US_25 | Odometer | 10,251 |
| 6:00 PM | ATM_US_25 | Odometer | 10,256 |
Now ask a seemingly simple question:
How many miles did ATM_US_25 travel that day?
You can't sum the readings. 10,243 + 10,251 + 10,256 is meaningless.
Instead, you need to identify the appropriate first valid odometer reading for the machine during the period and the appropriate last reading, then calculate the difference.
In this example: 10,256 − 10,243 = 13 miles.
Repeat that for every day in the period and you get a chart like this one, produced from a question asked in plain language rather than from a hand-written query:
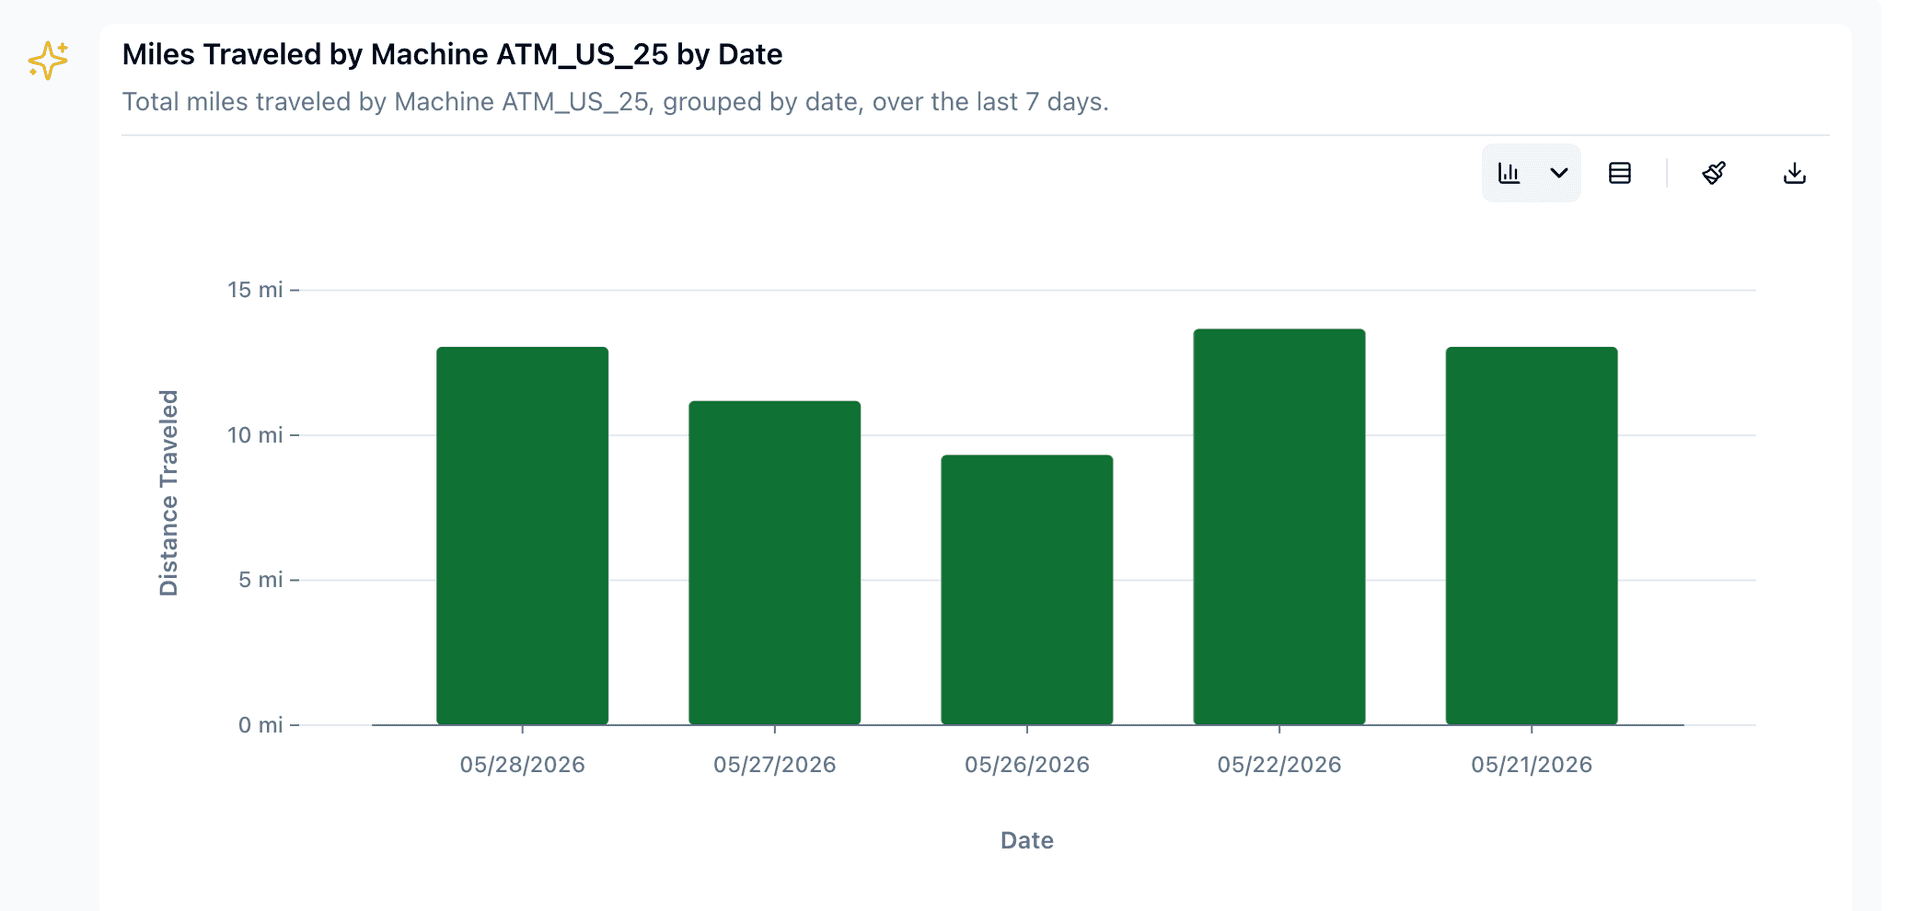
Now look at the horizontal axis rather than at the bars. A week was requested. Five days came back. Machine ATM_US_25 reported no distance at all on 23, 24 and 25 May.
Is that a machine that didn't work, or a machine that didn't report? The telemetry by itself cannot tell you, and the answer changes every utilization number that depends on it.
Now ask:
How many miles did all the machines at this location travel that day?
The calculation becomes more involved. You need to identify the first and last appropriate readings for each individual machine, calculate the difference for each, and then aggregate those machine-level results across the site.
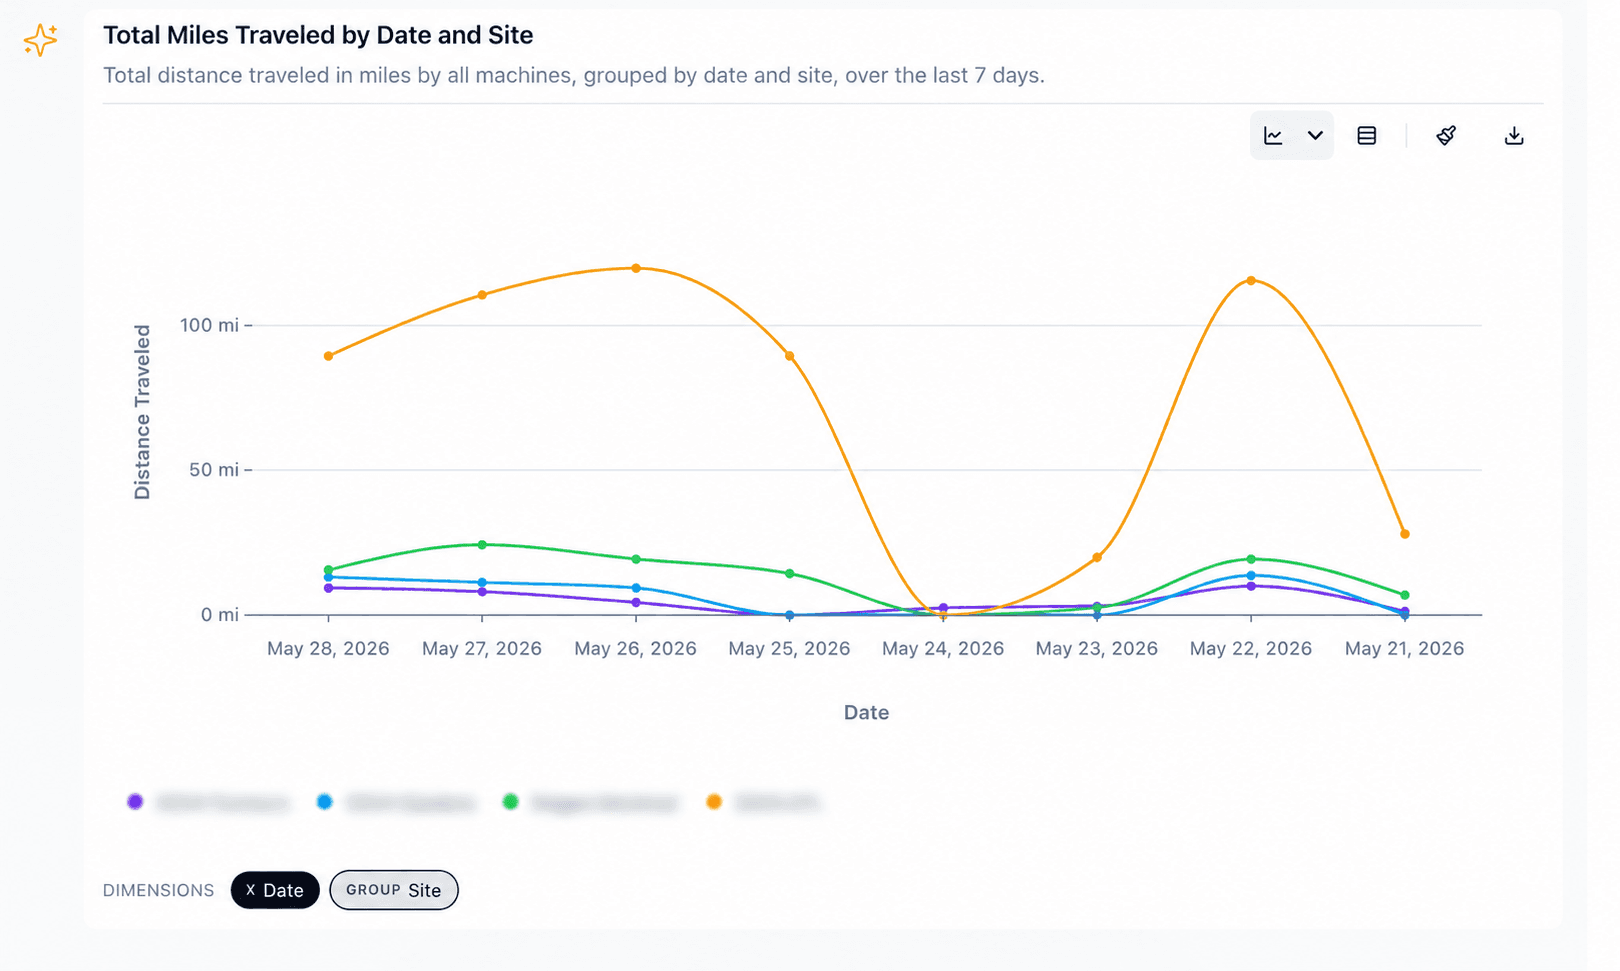
Four sites, eight days, every machine rolled up. One site does most of the work, running near 90 miles on 28 May while the other three together contribute roughly 40. And every line falls close to zero on 24 May, a Sunday.
Notice also that the fleet was clearly working on 25 May, even though ATM_US_25 reported nothing at all that day. The gap in the first chart belongs to that one machine, not to the yard around it.
Extend that across dozens of machines, multiple sites, thousands of readings, and months of history.
Then introduce the realities of telemetry data: missing readings, machines coming online at different times, reporting gaps, timezone boundaries, state changes, and potentially erroneous sensor values.
Suddenly, "How many miles did the fleet travel yesterday?" isn't such a simple question.
Telemetry Tells You What Happened. Context Tells You What It Means.
This illustrates a broader problem with connected-product analytics.
Raw telemetry contains technical information. It doesn't necessarily contain business meaning.
A database can tell you that TYPE = ODOMETER. It can tell you that MACHINE_ID = ATM_US_25.
But it doesn't inherently know that answering a question about daily distance requires finding the relevant first and last readings for each machine, calculating the difference, and then aggregating those differences across the requested fleet or site.
That knowledge exists somewhere else.
It may be encoded inside SQL written by an analyst. It may be embedded in a dashboard calculation. It may exist in technical documentation. Or it may simply live in the head of the engineer or analyst who understands the telemetry.
The same challenge applies to more sophisticated operational concepts.
What constitutes idle time? When does a machine move from "available" to "in use"? How should charging time affect utilization? Does a connected trailer indicate productive activity, or must the machine also be moving? How should multiple state changes within a reporting interval be interpreted?
These aren't merely data questions. They are questions about how the business interprets the data.
Telemetry tells you what the machine reported. Business context tells you what those signals mean.
And AI analytics needs both.
Why Dashboards Eventually Become a Bottleneck
The traditional response to this complexity is to encode the required logic into dashboards.
Customers want fleet utilization, so the provider builds a utilization dashboard. They want charging analysis, so it builds a battery and charging dashboard. They want site comparisons, so it builds another dashboard.
Each dashboard requires someone to understand the telemetry, develop the underlying SQL or transformation logic, validate the calculations, design the visualization, test it, deploy it, and maintain it.
And then customers inevitably ask new questions.
Can I see utilization by shift? Can I compare weekdays to weekends? Can I identify machines with high idle time? Can I compare utilization across locations? Can I see machines that are spending more time charging but traveling fewer miles?
Some of these requests may justify permanent dashboards. Many don't.
But each can create another request for the equipment provider's engineering, data, or analytics team.
This creates an unusual dynamic. The more successful the connected product becomes, and the more customers recognize the value of its data, the greater the analytical burden on the provider.
The manufacturer can gradually find itself running a custom analytics development organization alongside its core business.
For a growing equipment company, that may not be where it wants its scarce technical resources focused.
The Dashboard Can Only Answer Questions Someone Thought of in Advance
This is one of the fundamental constraints of traditional BI.
A dashboard is excellent at answering known, recurring questions. An operations manager should absolutely have a dashboard showing utilization, idle time, equipment availability, charging status, and other critical KPIs.
But dashboards require someone to decide in advance which questions matter. Someone chooses the metrics. Someone chooses the dimensions. Someone creates the filters. Someone determines the drill paths. Someone designs the visualizations.
Operational environments aren't nearly that predictable.
A site manager might suddenly ask: "Which five machines had the highest idle time during the morning shift last week?"
A regional manager might want to know: "Which locations have increased equipment utilization over the last 90 days?"
A fleet manager could ask: "Show me machines where charging time increased while productive hours decreased."
These may be extremely valuable questions. They just aren't necessarily questions worth creating permanent dashboards to answer.
Natural language analytics changes that relationship. Instead of translating every new business question into an analytics development request, the user can simply ask the question.
Why Putting an LLM on Top of the Database Isn't Enough
It is tempting to think that modern generative AI solves this problem automatically. Connect an LLM to the telemetry database, give it text-to-SQL capabilities, and let customers start asking questions.
But the odometer example illustrates why that can be dangerous.
Ask: "How many miles did our fleet travel yesterday?"
An AI system that understands SQL but doesn't understand the business meaning of the telemetry could generate a perfectly valid query that produces a completely incorrect answer.
The problem isn't necessarily the AI model. It is missing context.
To correctly calculate distance traveled, the AI needs access to knowledge describing the telemetry type, machine relationships, time period logic, first and last valid readings, machine-level calculations, and fleet-level aggregation.
The same applies to utilization, idle time, charging efficiency, productive operating hours, and potentially hundreds of other operational metrics.
This is where a contextual semantic layer becomes critical.
Rather than asking the AI to infer this logic every time someone asks a question, the semantic layer can explicitly represent how the organization interprets its data.
Distance Traveled becomes more than a phrase. It becomes a governed analytical concept connected to the appropriate telemetry, calculations, relationships, and physical data.
The AI is then reasoning against an established understanding of the business rather than trying to reconstruct that understanding at query time.
From Static Dashboards to an AI-Powered Analytical Service
This doesn't mean dashboards disappear. Quite the opposite.
Known, recurring operational KPIs are often best presented through dashboards. A fleet manager shouldn't have to ask every morning how many machines are available or what yesterday's average utilization was.
The more interesting architecture combines both approaches.
At the foundation is the telemetry platform containing the machine data. Above that sits a contextual semantic layer representing the business meaning of that data: machine relationships, telemetry interpretation, operational metrics, calculations, rules, and definitions.
That governed context can then power multiple analytical experiences.
- Traditional dashboards can continue to monitor recurring KPIs.
- AI can dynamically generate new dashboards and visualizations.
- Natural language interfaces can answer exploratory questions.
- Agents can eventually monitor operational conditions and proactively identify exceptions or opportunities.
The semantic foundation remains common across all of them.
This changes the role of the dashboard. The dashboard is no longer the place where business logic has to live. It becomes one of many ways governed business logic can be consumed.
That is a significant architectural shift.
Why Not Just Build Your Own Copilot?
For an equipment manufacturer, another reasonable question is: why not simply build a custom AI copilot?
Technically, it can.
But the real question is whether it should. In an earlier post we wrote about the framework to use when considering build, boost or buy.
A growing equipment provider's differentiated expertise is likely in engineering sophisticated machines, battery systems, vehicle controls, fleet operations, and the specialized workflows of its customers.
Building an enterprise-grade analytical AI platform requires a very different set of capabilities: semantic modeling, natural language query, AI orchestration, governance, model management, analytics generation, security, and ongoing adaptation as AI technology changes.
The opportunity cost matters. Every engineering resource devoted to rebuilding horizontal AI analytics infrastructure is a resource not focused on the company's core product and domain expertise.
The strategic question isn't "Can we build it?"
It is: "Is this where we create differentiated value?"
Increasingly, the better approach may be to capture the manufacturer's unique operational knowledge in a semantic foundation and let purpose-built AI infrastructure handle the analytical experience.
The Economics of Customer Analytics Start to Change
This is where the transformation becomes particularly interesting.
Under the traditional model, more customer analytics requirements lead to more development work, which leads to higher service costs. Every new question can potentially become another dashboard request, SQL query, or engineering project.
An AI-powered analytical service changes that equation.
Customers gain the ability to explore their operational data without every new question becoming a development request. That reduces the analytical burden on the equipment provider while simultaneously increasing the value of the information it provides.
And that creates another opportunity.
Analytics itself can become a product.
A provider might include standard operational dashboards as part of its core service while offering more sophisticated capabilities, such as conversational analytics, dynamic dashboards, optimization analysis, benchmarking, or proactive AI recommendations, as premium services.
The telemetry was already being generated. The data was already being collected.
What changes is the provider's ability to turn that data into a scalable customer experience.
Instead of analytics being primarily a cost center required to support the product, it can become an incremental revenue opportunity.
From Equipment Differentiation to Experience Differentiation
Consider two equipment providers selling broadly comparable machines.
The first says: "Here is the equipment, and here are the standard reports available in our fleet portal."
The second says: "Here is the equipment. You can also ask questions about the performance of your entire fleet in natural language."
Which machines are underutilized? Ask. Which locations improved productivity this quarter? Ask. How did charging behavior change after the new shift schedule? Ask. Which machines have the greatest opportunity to increase productive hours? Ask.
The differentiation is no longer limited to the physical equipment. It extends into the intelligence surrounding the equipment.
And because the manufacturer understands its machines better than almost anyone else, it has something extremely valuable to contribute: the domain knowledge required to correctly interpret the telemetry.
AI provides the interface. The manufacturer's business knowledge provides the meaning.
The Opportunity Goes Far Beyond Vehicles
The same pattern applies across the connected-product economy.
Industrial machinery generates telemetry. Construction equipment generates telemetry. Warehouse robots generate telemetry. Agricultural machinery generates telemetry. Medical devices generate telemetry. Energy systems generate telemetry. Smart buildings generate telemetry.
For years, the IoT conversation focused heavily on connecting those assets and collecting their data. The next phase focused on monitoring them through dashboards.
The next opportunity may be to make that operational data conversational, contextual, and intelligent.
The pattern becomes:
Connected Product → Telemetry → Governed Business Context → AI → Customer Value
The critical step is the one in the middle.
Without context, AI sees readings, timestamps, machine IDs, and telemetry types.
With context, it can begin to understand utilization, productivity, availability, efficiency, operational performance, and the other concepts customers actually care about.
Stop Asking What Dashboard to Build Next
Connected machines are extraordinarily good at generating data. Modern cloud platforms are extraordinarily good at storing it. And today's AI models are extraordinarily good at understanding questions.
But something still has to connect those three worlds.
That something is business context.
The equipment provider knows how odometer readings become distance traveled. It knows how state changes become utilization. It understands what charging behavior means for availability. And it knows which patterns matter to customers operating the equipment.
When that knowledge remains buried in SQL queries and individual dashboards, every new analytical experience requires more development.
When that knowledge is captured in a governed contextual semantic layer, it becomes reusable. Dashboards can use it. Natural language analytics can use it. AI-generated visualizations can use it. Agents can use it. And entirely new customer experiences can be built on top of it.
That changes the question for connected-product companies.
Instead of continually asking "What dashboard should we build next?", perhaps the better question is:
"What questions should our customers be able to answer?"
That is more than a new approach to analytics. It is an opportunity to turn machine telemetry into customer value, and turn analytics from a resource burden into a competitive advantage and potentially a new source of revenue.
About Codd AI
At Codd AI, we believe enterprise AI should reason from a shared, trusted understanding of the business, not from isolated prompts or disconnected data sources. Our AI-powered contextual semantic layer combines technical metadata, business knowledge, governance, and human certification into a reusable enterprise foundation for conversational analytics, AI copilots, and agentic workflows.
By helping organizations capture and govern business context once, Codd AI enables every AI and BI application to deliver more consistent, explainable, and trusted insights, today and as the AI landscape continues to evolve. To learn more, visit us at www.codd.ai.