

The Gap Between Knowing and Doing
Every analytics team has felt it. The dashboard lights up red. The metric crosses a threshold. A weekly report surfaces a trend that demands attention. And then nothing happens. Not because people don't care, but because the distance between seeing a signal and acting on it is still a manual, fragile chain of steps: check the data, notify the right people, get approval, trigger a response.
We built Playbooks to make analysis repeatable and deterministic. But repeatable analysis alone doesn't close the loop. The analyst still has to run the playbook, interpret the result, and decide what to do next. Multiply that across dozens of metrics and teams, and you have an organization rich in insight but slow to respond.
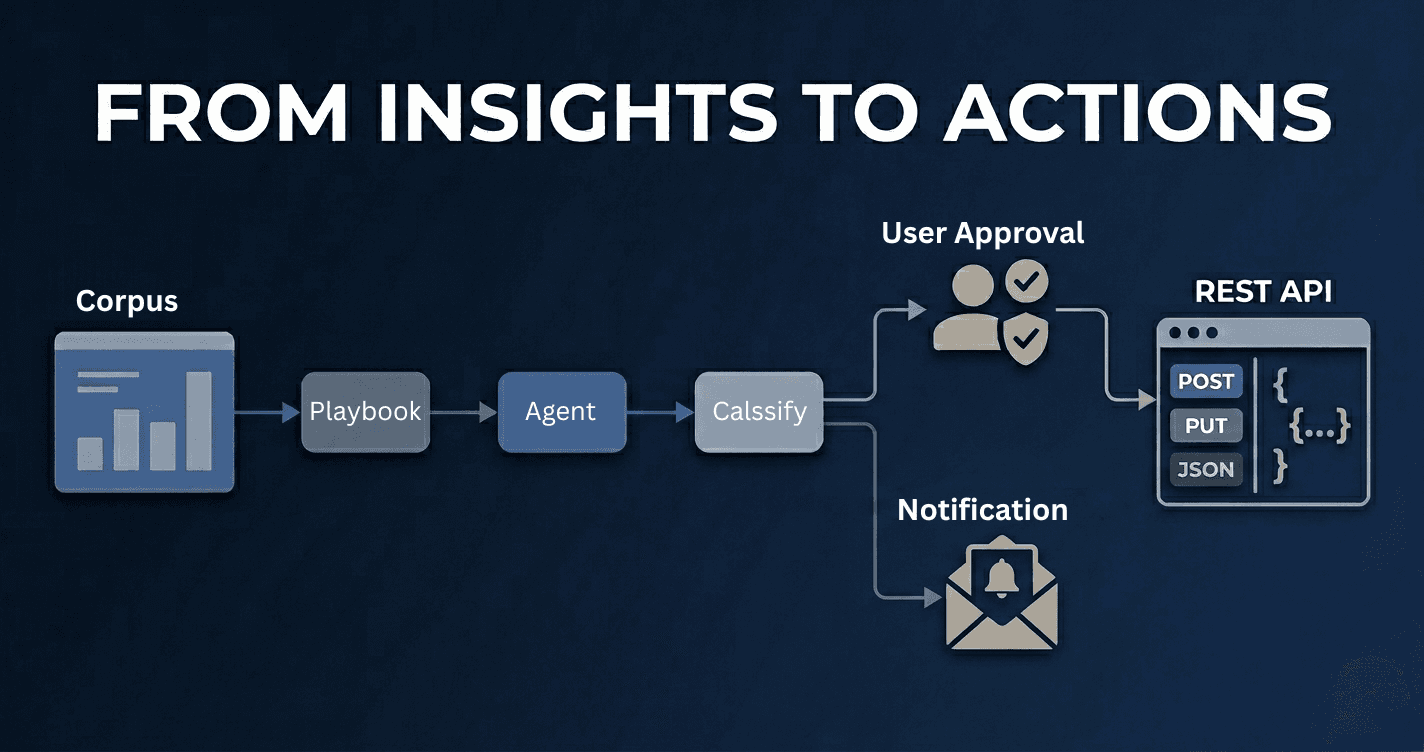
Actions bridge that gap. They turn analytical workflows into executable pipelines, complete with scheduling, conditional branching, human approvals, and multi-channel notifications. If Playbooks are the brain, Actions are the nervous system.
What Is an Action?
An Action is a directed workflow of steps, a visual pipeline you build by connecting nodes on a canvas. Each node performs a specific operation: run an AI agent, execute a SQL query, evaluate a metric, classify an output, request human approval, or trigger a downstream playbook. Edges between nodes define the flow of data and control.
Think of it as a programmable response plan for your data. Instead of writing scripts or stitching together tools, you compose workflows visually, and the platform handles orchestration, parallelism, failure recovery, and notification delivery.
A simple Action might look like this:
Start → Run SQL Query → Classify Risk Level
                            ├── High → Notify Slack + Request Approval
                            └── Low  → Log and Close
A complex one might fan out analysis paths, converge results, and route decisions through conditional branches, all executing in parallel where possible.
A Concrete Example: Collateral Risk Alert for Florida
Consider a lending organization that needs to monitor the ratio of Forced Liquidation Value (FLV) to Market Value (MV) for collaterals in Florida, a key indicator of portfolio distress.
Without Actions:
- An analyst manually queries the database for FLV and MV figures across Florida collaterals
- They calculate the ratio in a spreadsheet
- They eyeball whether the ratio has drifted into distress territory
- If it has, they draft an email to the risk team
- Steps 1–4 repeat every day, assuming no one forgets
With Actions:
Start (bind to Lending corpus)
  → Agent: "Find out the ratio of total Forced Liquidation Value
            to Market Value (Ratio = (FLV / MV) × 100) for
            collaterals in Florida. Return just the % number."
  → Classify MV to FLV Ratio:
      ├── Normal Range → End (log clean status)
      └── Extreme Distress
            → Agent: Send an email alert to the risk team
              with the distress ratio and affected collaterals
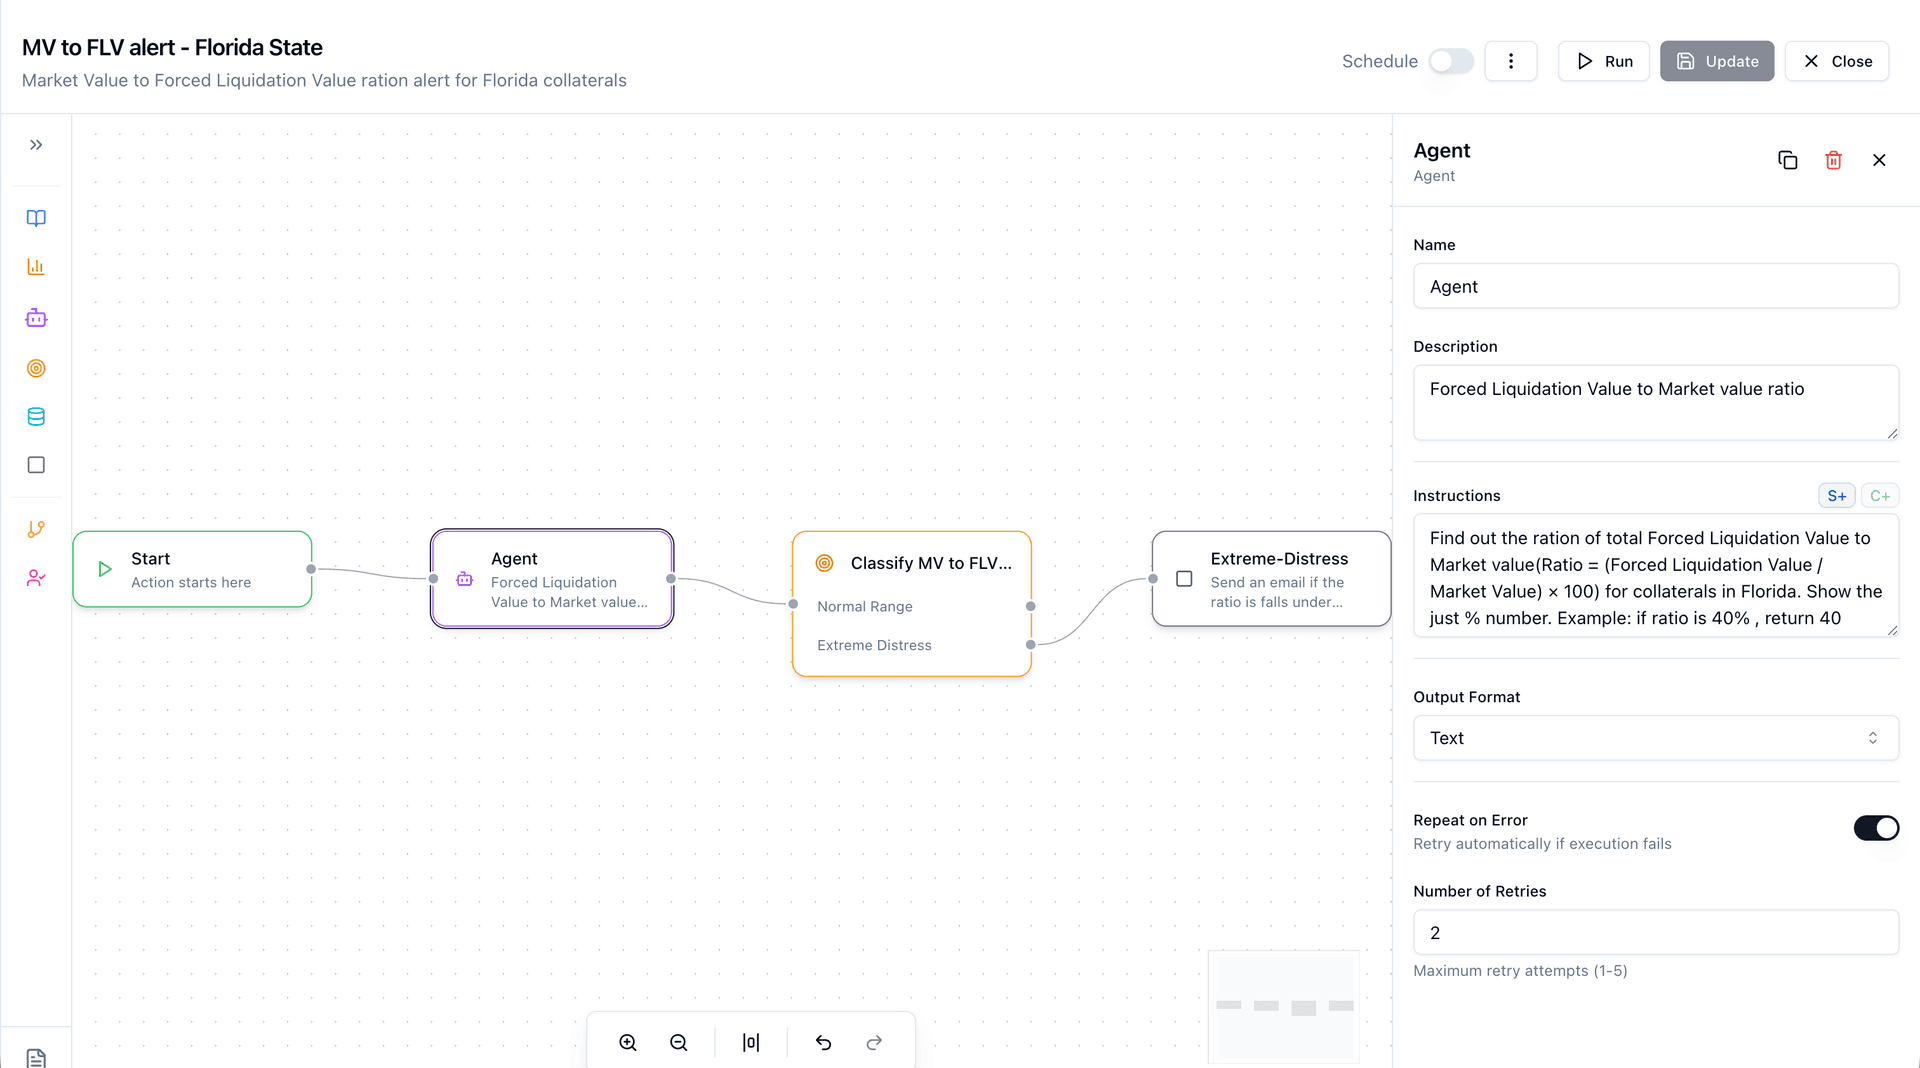
This is a real Action built in Codd. The first Agent node computes the FLV-to-MV ratio using AI against the connected data sources. The Classify node evaluates the result and routes execution: if the ratio falls within a normal range, the workflow completes quietly. If it signals extreme distress, a follow-up Agent fires off an email notification to the right people.
Schedule it daily. The risk team only hears about it when there's something worth hearing about. Every run is logged, every ratio recorded, every notification traceable.
The Visual Builder
Actions are designed in a visual canvas, not in code, not in YAML, not in a configuration wizard. You build workflows by dragging nodes from a palette and connecting them with edges, the same way you'd sketch a flowchart on a whiteboard. Except this flowchart executes.
The builder is built on React Flow with a left-to-right layout that reads like a process diagram. A collapsible Node Palette on the left organizes available step types into two categories: Steps (Start, Agent, SQL, Metric, Playbook, Classify, End) and Logic (Condition, User Approval). Drag a node onto the canvas, connect it to an upstream step, and configure it in the side panel.
Each node type has a distinct visual identity. Color-coded borders and icons make it immediately clear what kind of work each step performs. Purple for AI agents. Cyan for SQL. Orange for metrics. Pink for approval gates. You don't need to read labels to understand the shape of a workflow at a glance.
Selecting a node opens the Configuration Panel, which adapts its form to the node type:
- Agent nodes show an instructions editor where you describe what the AI should analyze, plus optional notification channels (Slack, Email, Teams).
- SQL nodes provide a query editor with optional "Analyze with AI" toggle. Run the query raw, or layer AI interpretation on top.
- Metric nodes let you pick from your corpus's defined metrics, again with optional AI analysis.
- Classify nodes let you define categories that the AI will use to route downstream execution. Each category becomes a branch.
- Condition nodes support expression-based branching (e.g.,
metricStep.output > 100) with operators like==,!=,>,<,>=,<=. - User Approval nodes let you select approvers from your organization and configure notification channels: Slack, Email, or Microsoft Teams.
The canvas supports undo/redo, auto-arrange (horizontal layout optimization), zoom controls, and a minimap for navigating complex workflows. Keyboard shortcuts and direct manipulation keep the design loop tight.
Before saving, the platform runs comprehensive validation: every node must be connected, every configuration must be complete, no duplicate names, no orphaned branches. Condition expressions are parsed and checked against actual step IDs in the workflow. You can't deploy a broken pipeline.
The Building Blocks
Actions are built from a focused set of node types, each designed to handle a specific responsibility in the workflow.
Step Types
| Node | What It Does |
|---|---|
| Start | Initializes the workflow. Binds to a corpus (your data context) and sets runtime variables. |
| Agent | Executes an AI-powered analysis step with custom instructions, the same engine behind Codd's chat interface. |
| SQL | Runs a SQL query against your connected data sources, with optional AI interpretation of results. |
| Metric | Pulls a predefined metric and optionally layers AI analysis on top. |
| Playbook | Embeds a full Playbook execution as a single step, providing composability at the workflow level. |
| Classify | Routes execution down different branches based on AI-driven categorization of upstream output. |
| Condition | Evaluates expressions against step outputs to control branching logic. |
| User Approval | Pauses execution and notifies designated approvers via Slack, Email, or Teams. Resumes on decision. |
| End | Marks workflow completion and finalizes execution logs. |
The power isn't in any single node. It's in the composition. A Classify node after an Agent node means your workflow can reason about its own output and route accordingly. A User Approval node between analysis and notification means a human stays in the loop, but only when needed.
How Execution Works
Under the hood, every Action compiles into a directed acyclic graph (DAG). This isn't just a visual metaphor. It's the literal execution model. The platform walks the graph, resolves dependencies, and runs independent branches in parallel.
The Execution Lifecycle
-
Trigger - An Action fires in one of three ways: manually by a user, on a cron schedule, or in response to an external event.
-
Graph Resolution - The workflow definition is parsed into an execution graph. The system validates structure (no cycles, all nodes reachable), identifies start nodes, and computes dependency counts for each step.
-
Parallel Execution - Worker coroutines pull ready nodes from a queue. A node becomes "ready" when all its upstream dependencies have completed. Multiple steps execute concurrently, bounded by per-tenant concurrency limits to prevent resource exhaustion.
-
Conditional Routing - When a Classify or Condition node completes, only the matching downstream branch is activated. Non-matching branches are marked as skipped, with no wasted or ambiguous state.
-
Approval Gates - If execution reaches a User Approval node, the workflow pauses. Approvers receive notifications through their configured channels: a Slack message with approve/reject buttons, an email with secure action links, or a Teams adaptive card. On approval, execution resumes. On rejection, the workflow either follows a rejection branch (if one exists) or gracefully terminates downstream steps.
-
Finalization - When all paths reach a terminal state, the system computes execution statistics, uploads logs to persistent storage, and broadcasts a completion event.
Failure Handling
Not every step succeeds. The platform supports three failure policies, configurable per node:
| Policy | Behavior |
|---|---|
| Stop | Halt execution. Skip all downstream nodes. Mark the workflow as failed. |
| Continue | Mark the step as failed, but allow parallel branches to complete. The workflow finishes with a partial status. |
| Escalate | Same as Continue, plus send an escalation notification to the workflow owner. |
This granularity matters. A non-critical enrichment step failing shouldn't kill an entire monitoring pipeline. But a core data validation step failing absolutely should.
Real-Time Visibility
When an Action runs, you're not watching a progress bar and hoping for the best. The platform streams execution events over WebSocket in real time:
- Step started - which node is running, when it began
- Step progress - intermediate outputs, AI reasoning traces, tool invocations
- Step completed/failed/skipped - final status with output data and duration
- Workflow completed - aggregate statistics and outcome
Each node on the visual canvas updates live. Green for success, red for failure, gray for skipped, animated for in-progress. You see the DAG executing, not just its final state.
After completion, full execution logs are persisted and accessible from the run history. Every step's input, output, duration, and token usage is recorded, giving you a complete audit trail.
The Actions Dashboard
The main Actions page presents all workflows in a filterable data table. You can filter by status (enabled/disabled), trigger type (manual, scheduled, event), and corpus. Each row shows the action name, trigger configuration, last run time, outcome (success/partial/failed), and owner.
From any row, a dropdown gives you quick access: run now, view run history, edit, duplicate, or delete. The run history panel surfaces aggregate stats (total runs, success rate, failure count) alongside a chronological log of recent executions. Click into any run to see the full step-by-step trace.
Status toggles let you enable or disable scheduled actions without deleting them. Pause a pipeline during a data migration, re-enable it when you're ready.
Scheduling and Triggers
Actions support three trigger modes:
Manual - Run on demand from the UI. Ideal for ad-hoc investigation workflows or testing new pipelines before putting them on a schedule.
Scheduled - Define a cron expression or interval. The platform integrates with an external scheduler service that handles timing, retry, and fault tolerance. A daily compliance check. An hourly anomaly scan. A weekly executive summary, all running without human intervention.
Event-driven - Trigger in response to external signals. When a metric crosses a threshold, when a data pipeline completes, when an upstream system sends a webhook. This is where Actions become truly reactive.
Actions vs. Playbooks vs. Metricboards
Each serves a distinct purpose in the analytics workflow:
| Capability | Metricboard | Playbook | Action |
|---|---|---|---|
| Primary purpose | Monitor known metrics | Repeat a specific analysis | Automate an end-to-end response |
| Trigger | Always-on (passive) | User-initiated | Scheduled, event-driven, or manual |
| Branching logic | None | Sequential plays | Conditional routing with Classify/Condition nodes |
| Human-in-the-loop | Implicit (someone watches) | User interprets results | Explicit approval gates with multi-channel notification |
| Composability | Limited (linked views) | Standalone analysis | Embeds Playbooks, Metrics, SQL, and AI agents as steps |
| Parallelism | N/A | Sequential execution | Concurrent step execution with dependency resolution |
| Failure handling | Alert fatigue | Manual retry | Configurable per-step policies (Stop / Continue / Escalate) |
| Audit trail | View history | Run history | Full execution logs with step-level detail |
Metricboards tell you what happened. Playbooks tell you why it happened. Actions decide what to do about it.
Templates: Start from Proven Patterns
Not every team wants to build workflows from scratch. Actions supports a template system: pre-built workflow patterns that encode best practices for common use cases.
Templates can be organization-specific (built by your team) or platform-provided (curated by Codd). Browse by category, preview the workflow structure, and instantiate with a single click. Customize from there.
Common templates include daily metric monitoring, weekly report generation, anomaly detection and escalation, and approval-gated data operations.
The Design Philosophy
Three principles guided the architecture of Actions:
Composability over complexity. Each node type does one thing well. Power comes from combining them, not from making individual nodes more complicated. An Agent node doesn't need to know about Slack; that's what the notification layer handles. A Classify node doesn't execute remediation; it just routes.
Humans in the loop, not in the way. Approval gates are explicit and optional. When a workflow needs human judgment, it pauses cleanly and reaches out through the channels people already use. When it doesn't, it runs end-to-end without interruption.
Visibility by default. Every execution is observable in real time and auditable after the fact. There's no black box. You can trace exactly which branch was taken, which steps succeeded or failed, and what each AI agent reasoned before producing its output.
What This Means for Teams
Actions shift the operational model of analytics. Instead of analysts being the connective tissue between insight and action, manually shuttling information between tools and people, the workflow itself becomes the operator.
This doesn't replace analysts. It elevates them. The work moves from routine execution to workflow design: deciding what should happen when certain conditions arise, who should be involved, and what the escalation path looks like. That's higher-leverage work. That's institutional knowledge captured in executable form.
Exploration drives discovery. Playbooks drive consistency. Actions drive response.
Actions is available today in Codd. Get started